
Doping introduces foreign elements to change the composition and properties of a host material, and the doping concentration describes a content measured against some chosen statistical base.
In A1−xMxB, for instance, x is the fraction of the A/M sublattice occupied by M: x = 0.05 means that 5% of those sites are occupied by M, not 5% of all atoms. Mass fraction, atomic percentage over all atoms and site fraction use different denominators, so the same percentage can correspond to different compositions.
Nor does the nominal doping level in a formulation equal what finally enters the host. Elements can be lost during processing, or can form second phases. In one set of samples with nominal composition Te0.98M0.02(M = As, Sb, Bi), atom probe tomography measured average solute contents in the Te matrix of only 0.06, 0.03 and 0.09 at.%, with most of the added element residing in the corresponding telluride precipitates.
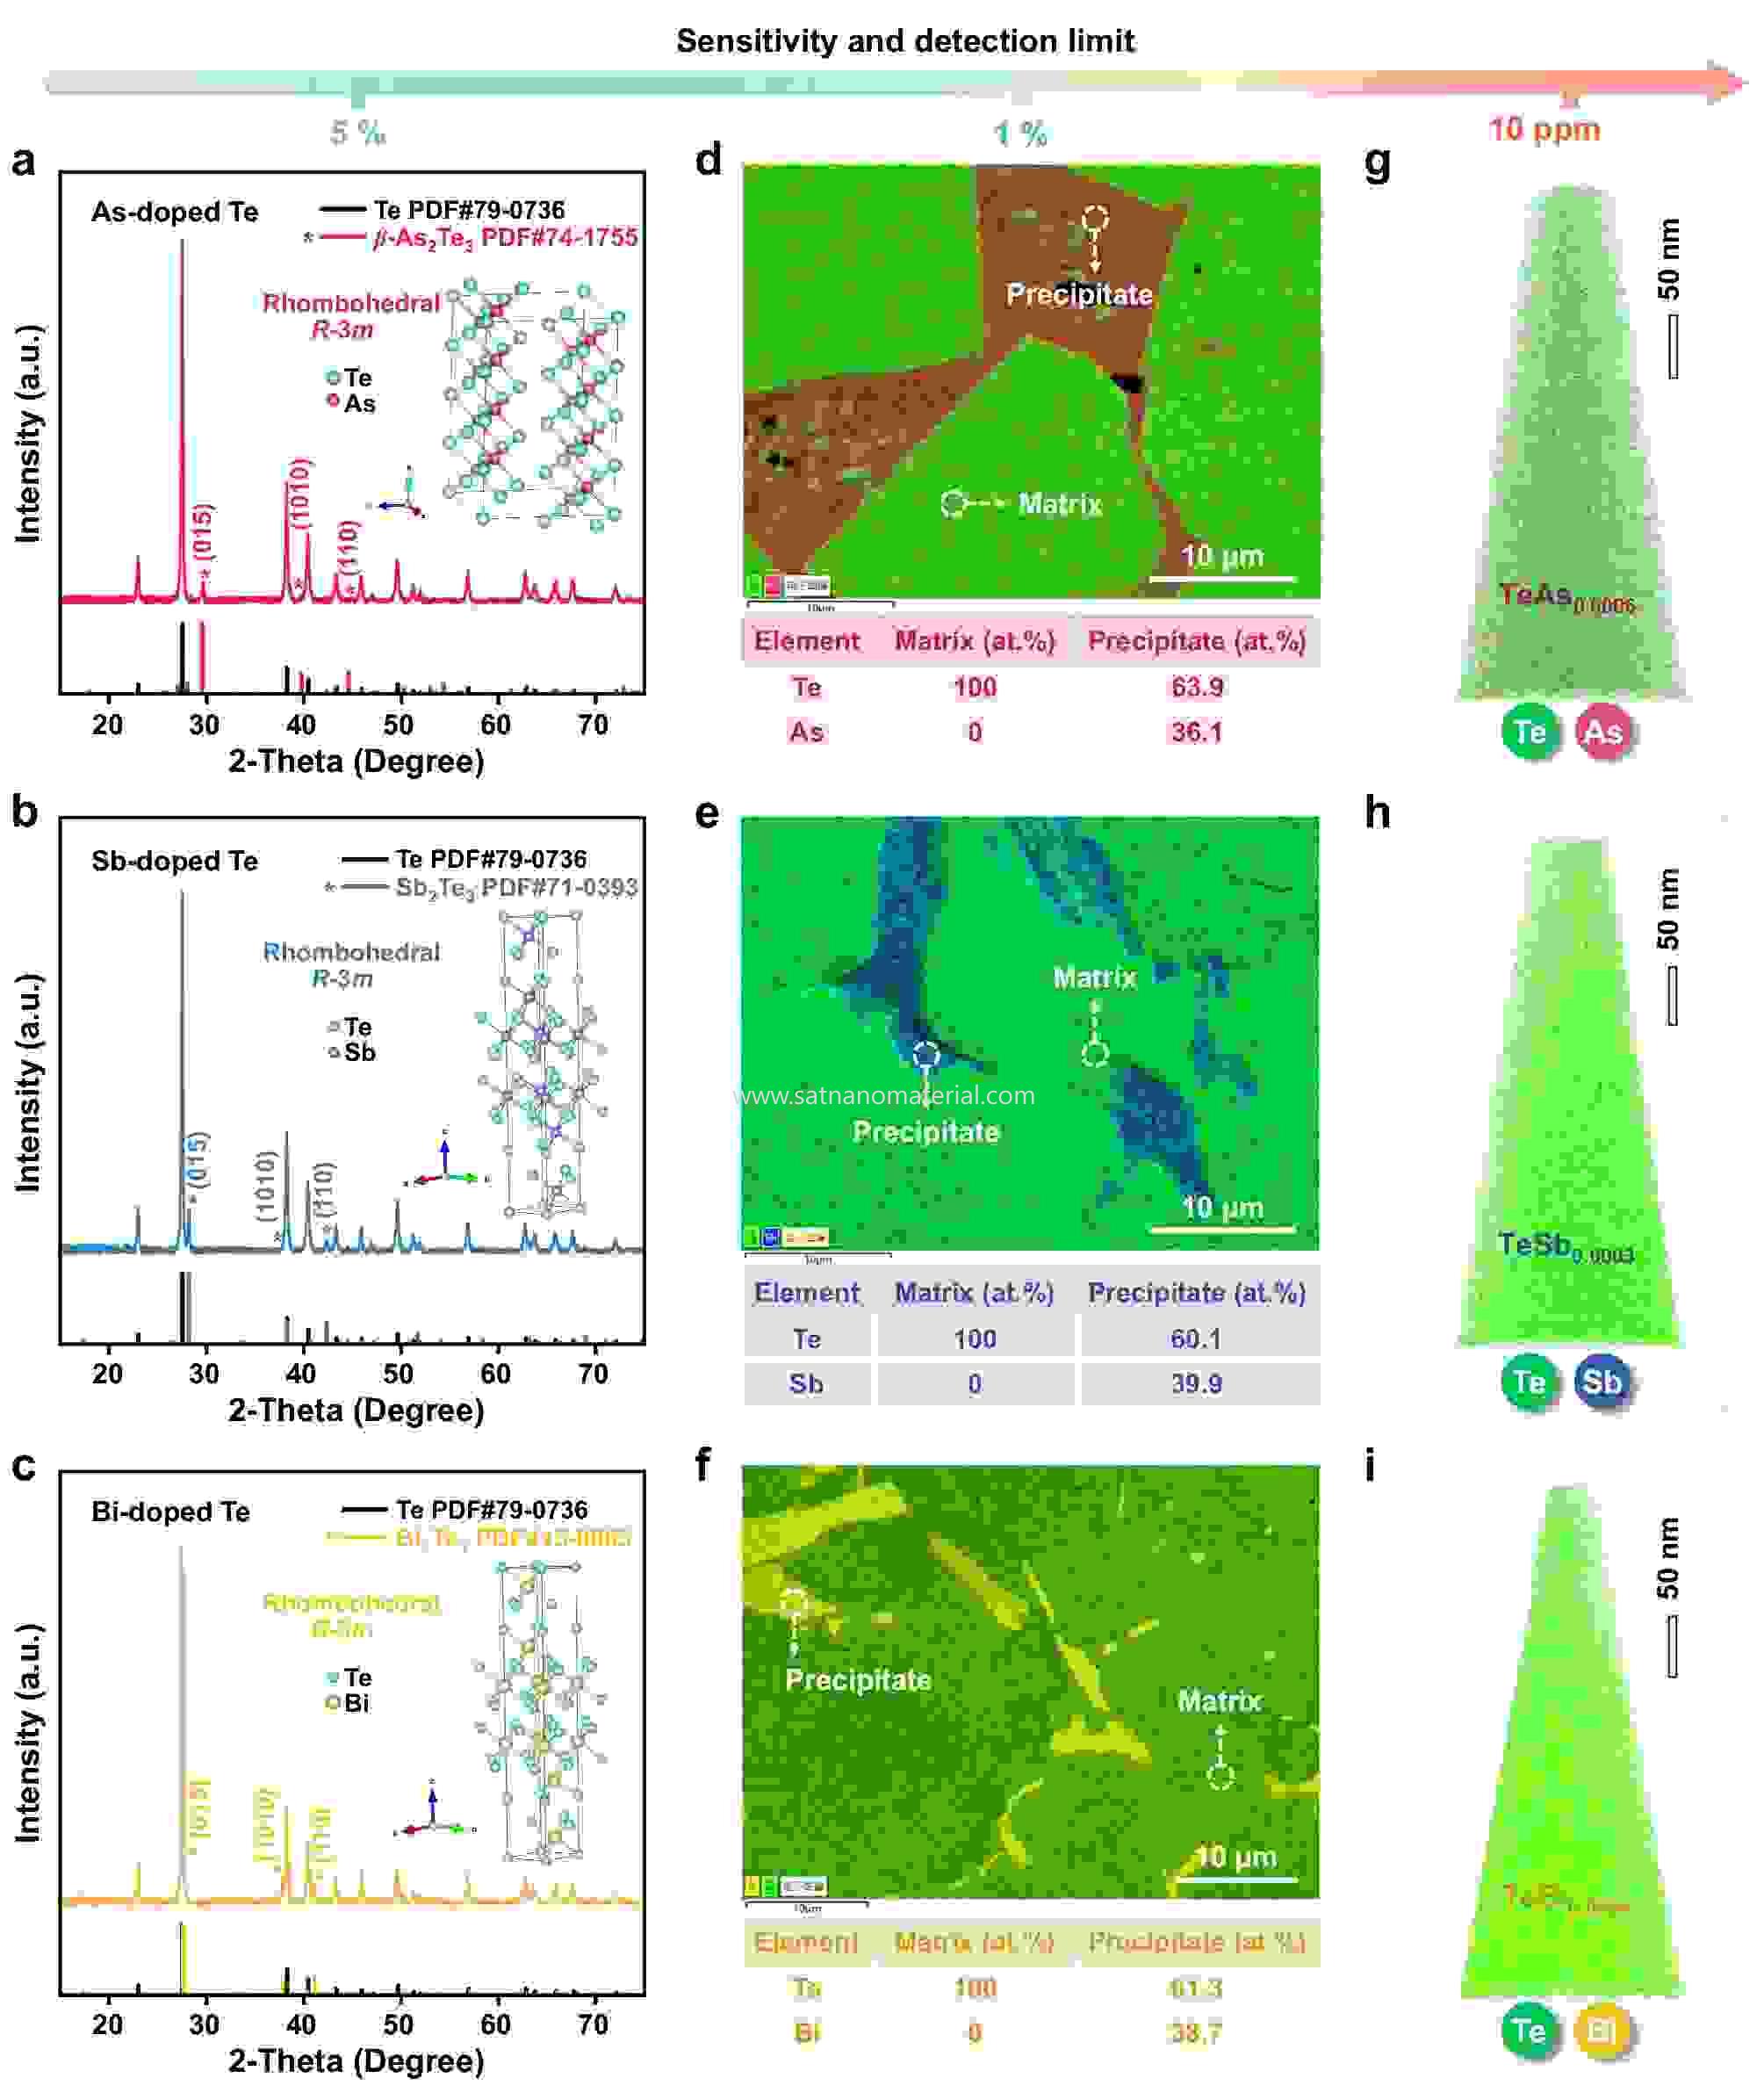
Figure 1.Phases, elemental distribution and matrix atom probe analysis in samples of nominal composition Te0.98M0.02(M = As, Sb, Bi).
Adding more material to the charge in such a system may mainly raise the fraction of second phase rather than raise the solute in the matrix proportionally. What the second phase does then depends on its own properties and on its interface with the matrix: in the Te system above, the regions containing telluride precipitates had higher conductivity, so the improvement cannot be credited entirely to substitutional doping inside the Te lattice. Limited solid solubility and improved composite performance can occur at the same time.
Even when the element has entered the lattice, chemical content and electrically active content remain different quantities. Donors supply electrons to the conduction band; acceptors take electrons from the valence band and leave holes behind. Whether they ionize fully, and whether they form compensating defects, determines how many free electrons or holes actually exist. A doping level expressed in atomic percent and a carrier concentration expressed in cm−3therefore differ in units — and can even follow different trends as the formulation changes.
In a model that considers only electrons, holes and singly charged donors and acceptors, charge neutrality requires n + NA−= p + ND+, where n and p are the free electron and hole concentrations and NA−and ND+the ionized acceptor and donor concentrations. Adding an impurity converts into added carriers only once the ionization and compensation relationships are fixed.
Compensation cancels the contributions of defects of opposite sign. An acceptor, for example, favours the creation of holes, but a donor that accompanies it can cancel part of that effect; some dopant atoms also alter the local structure and create defects of a different electrical character. As more dopant enters the lattice, the gain in free carriers can therefore shrink.
In one study of As-doped CdTe single crystals, both crystal types showed very low dopant activation, about 1–3% in one of them. Combining defect spectroscopy with first-principles calculations, the authors concluded that the main compensation most likely came from a donor-type defect known as the AX centre: a substantial lattice relaxation around the original acceptor creates a configuration able to compensate it. That explanation applies to the crystals and growth conditions of that study; it does not mean that As-doped CdTe has a fixed activation rate.
Once carriers are present in greater numbers, mobility also enters the conductivity. For an electron-dominated material, σ ≈ neμ, where e is the elementary charge and μ the mobility. The charged centres and local structural disorder introduced by doping strengthen scattering and lower μ; if the rise in n does not offset the fall in μ, σ may stop rising altogether. Compensation governs how many carriers can conduct; scattering governs how they drift.
Ionic conductors face the same contest between the number of defects and their ability to move. When Gd3+replaces Ce4+in CeO2and oxygen vacancies provide the only compensation, every two Gd ions correspond to one oxygen vacancy. A vacancy offers neighbouring oxygen ions a site to jump into, so more vacancies mean more opportunities for migration — but each jump must still overcome a local migration barrier.
At higher concentrations the association between dopant ions and oxygen vacancies can no longer be neglected, and vacancies also influence one another. Some sites accumulate vacancies more readily, while leaving those sites may cost more energy. A larger total number of vacancies therefore does not guarantee more long-range migration per unit time; the spatial distribution of defects also helps shape diffusion.
A simulation of Gd-doped CeO2containing dislocations separates these spatial effects. With an average Gd fraction of 8%, equilibration at 1300 °C produced enriched and depleted zones around the dislocations. In the subsequent molecular dynamics at 900 °C, the enriched zones held more vacancies yet still showed slower local oxygen diffusion than the dislocation-free bulk, while the depleted zones were limited by factors including a shortage of vacancies. What is compared here is local diffusion coefficients, not the measured conductivity of a bulk ceramic.
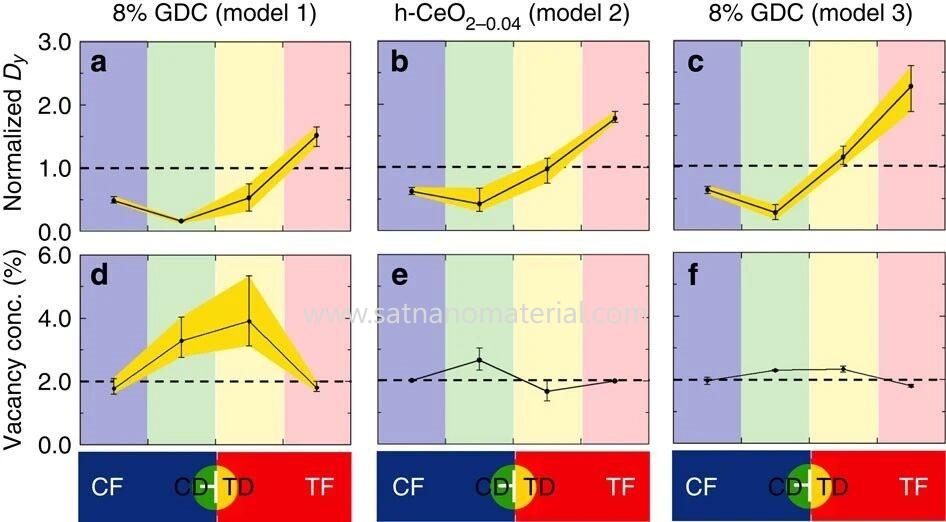
Figure 2.Local oxygen diffusion coefficients and oxygen vacancy concentrations of three CeO2models containing dislocations at 900 °C; diffusion coefficients are referenced to a dislocation-free bulk of the same nominal composition.
In that simulation oxygen vacancies rarely left the enriched zones and rarely crossed the depleted zones, whereas regions far from the dislocations came closer to isotropic diffusion. A high local vacancy count and fast long-range diffusion are different physical questions: the first counts defects within a region, while the second also depends on whether oxygen ions can keep migrating into other regions.
Thermoelectric materials convert a temperature difference into electrical energy, and their performance cannot be judged by electrical conductivity alone. The dimensionless figure of merit is ZT = S2σT/κ, where S is the Seebeck coefficient — the open-circuit thermal voltage per unit temperature difference — T the absolute temperature and κ the total thermal conductivity. A high S2σ favours electrical output and a low κ limits heat conducted straight through; both affect ZT.
Doping changes the carrier concentration and the band structure, and it also affects phonon scattering (a phonon being a quantum of lattice vibration). Carriers and band-structure changes act on S and σ, while phonon scattering changes heat conduction through the lattice. These quantities need not move in the same direction, so a fall in conductivity at one composition does not by itself decide whether ZT also falls.
In a concentration series of Al- and Sb-co-doped SnTe, raising the co-doping level lowered the hole concentration and mobility and hence the conductivity, while the Seebeck coefficient rose. Part of the increase in S is connected with the loss of holes, and part with Al-induced changes in the electronic states; alloying with AgBiTe2then shifted the bands further and affected S again. The performance change in this series therefore cannot be attributed entirely to the number of carriers.
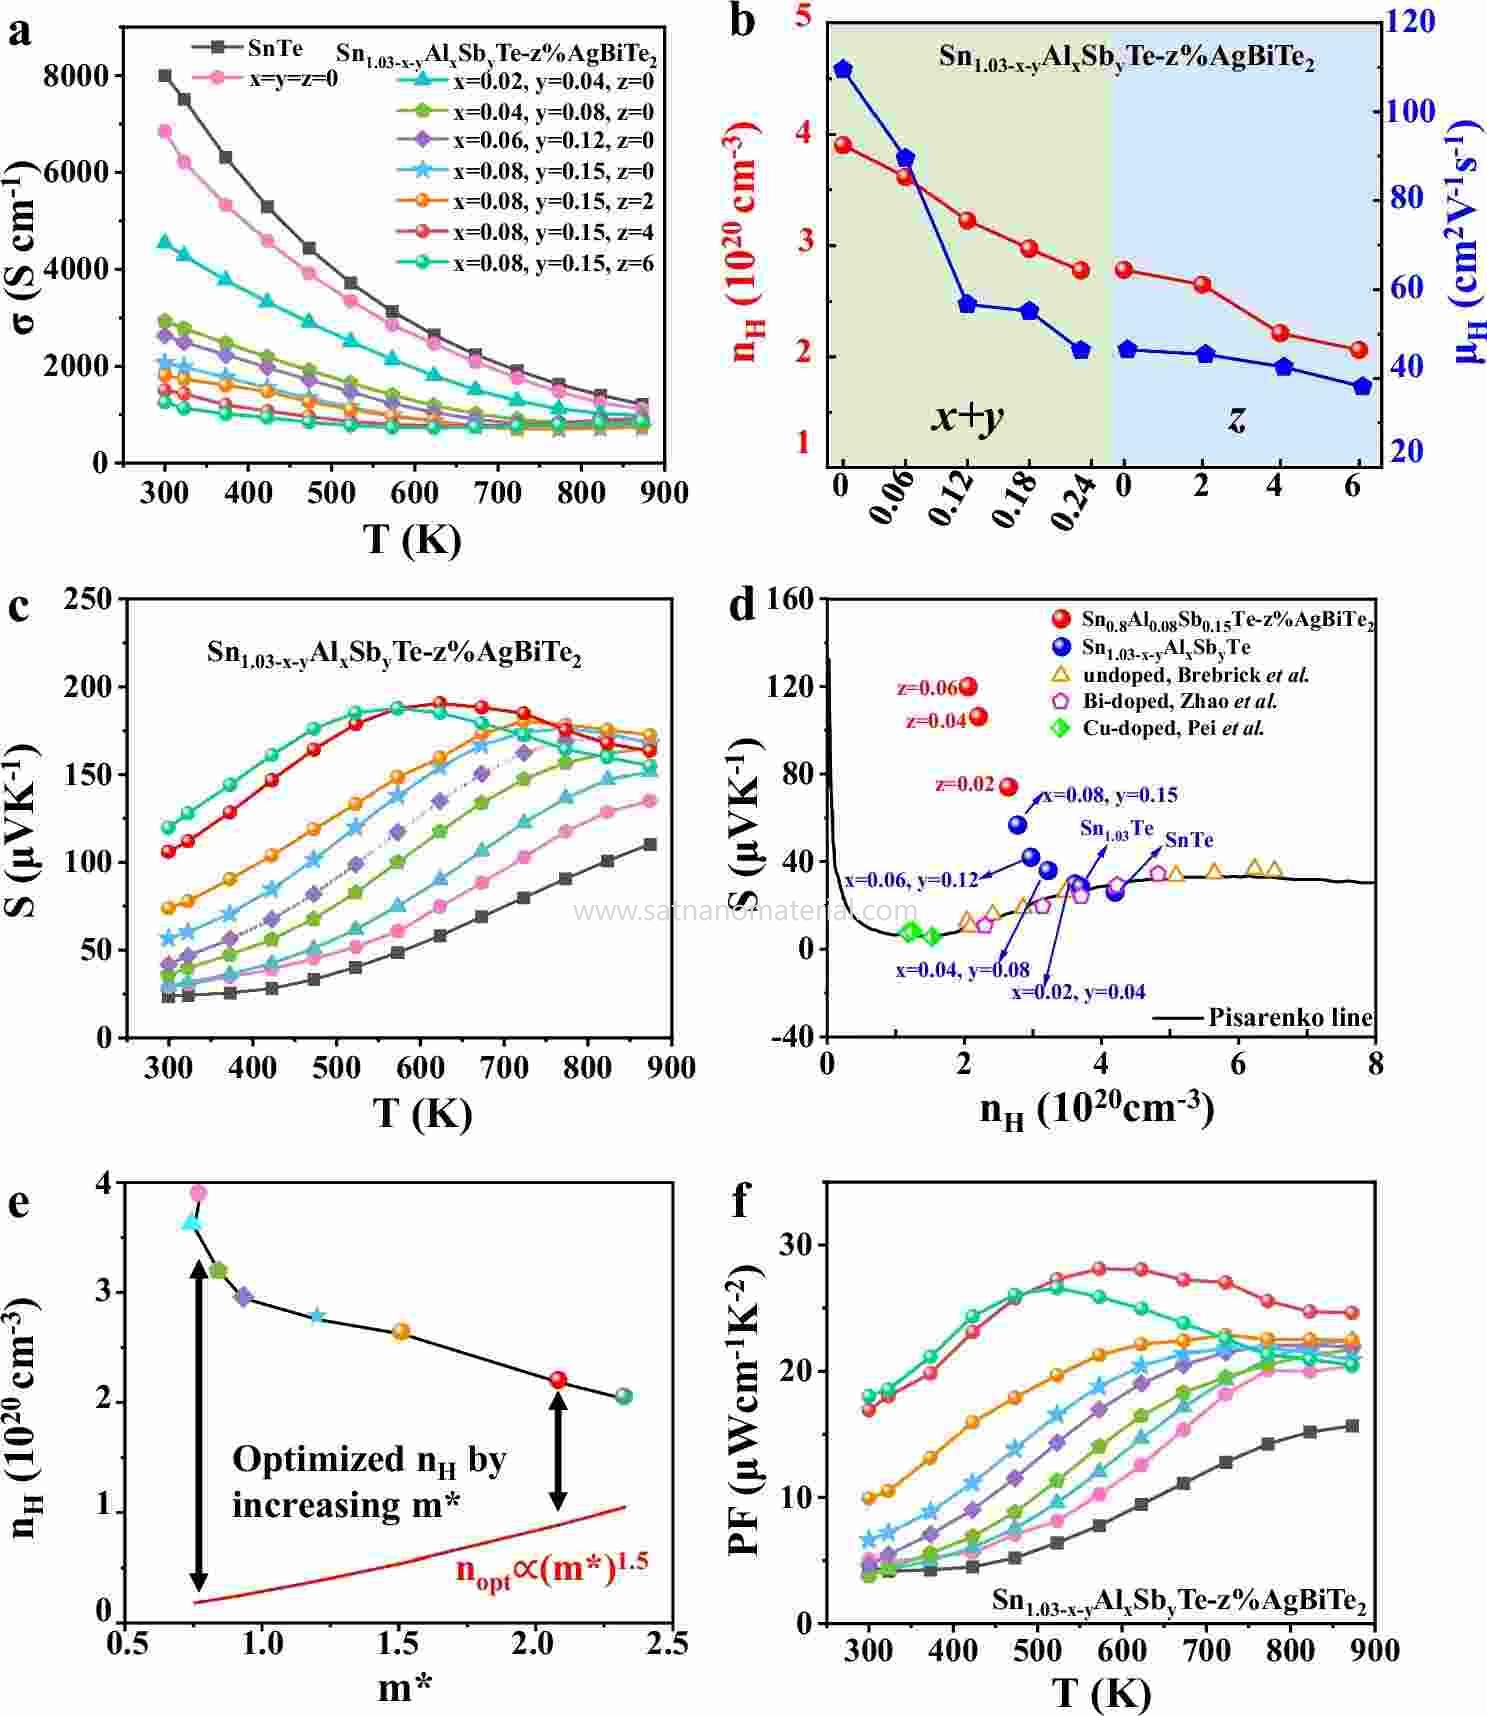
Figure 3.Electrical conductivity, Hall carrier concentration, mobility, Seebeck coefficient and power factor of Al- and Sb-co-doped, AgBiTe2-alloyed SnTe samples.
These compositional changes also bring point defects and dislocations that scatter phonons and lower the lattice thermal conductivity. Reduced heat transport, acting together with the changed electrical transport, allows some doped samples to reach a higher ZT despite lower conductivity. What competes here is not only electron transport but heat transport as well.
With the Al:Sb ratio fixed, raising the AgBiTe2alloying fraction from 4% to 6% in the same paper continued to lower the room-temperature Hall hole concentration, yet the 6% sample had a lower ZT than the 4% sample in the mid-temperature range. XRD of this concentration series detected no impurity phase, so the performance difference had already appeared within a range where no new phase gave a clear diffraction signal.
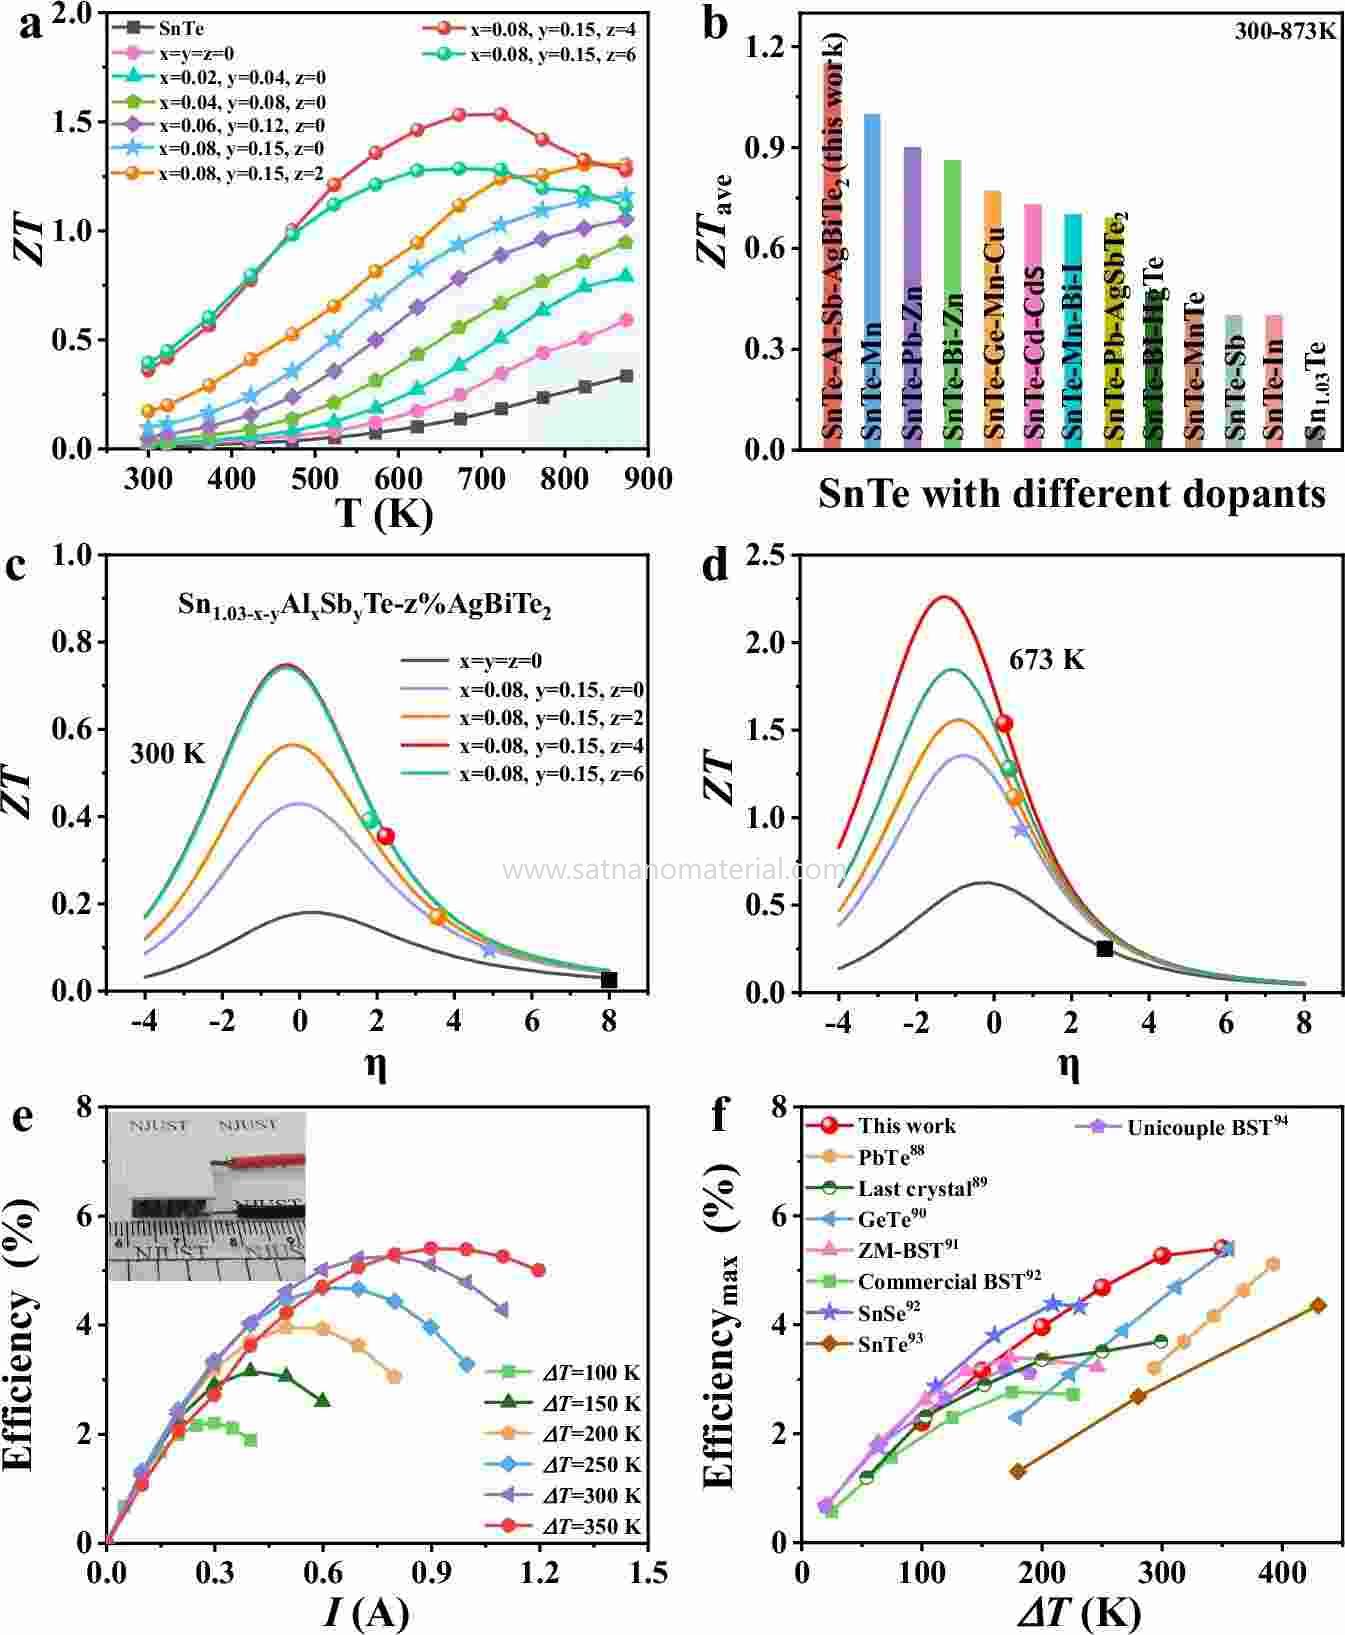
Figure 4.ZT, temperature and Fermi-level dependence, and device energy conversion performance of Al- and Sb-co-doped, AgBiTe2-alloyed SnTe samples.
The ZT gap between the two also varies with temperature, which means that the better ratio has a temperature window. In such narrow-gap materials, high temperature can also excite minority carriers, strengthening bipolar transport and altering both the Seebeck coefficient and the heat flow; the relative contributions of band structure, carrier number and their scattering shift accordingly. A carrier concentration that is favourable at one temperature will not necessarily give the highest ZT at another.
SAT NANO is a best supplier of nano material in China, we can supply the nitride doped material like nitride doped tio2, nitride doped carbon nanotube, silver doped tio2 powder. If you have any enquiry, please contact us at admin@satnano.com .


 online service
 13929258449
 admin@satnano.com
 + 8613929258449


